A Friendly Guide to Google Analytics for Beginners
So you've got a website for your business. That's awesome. But then comes the big, nagging question: is anyone actually looking at it? And if they are… what are they doing?
That's where Google Analytics comes in. It's a free tool that tells you the story of your website. At its core, it helps you understand how many people visit your site, which pages they look at, and how they found you in the first place.
What Is Google Analytics Anyway?
Alright, let's start from square one. You've probably heard the term ‘Google Analytics’ tossed around, and maybe it sounds a bit technical or intimidating. I promise, it's not as scary as it seems.
Think of it like a friendly, incredibly sharp receptionist for your website. This receptionist sees everyone who walks through your digital front door and can tell you exactly what’s happening, day in and day out.
It’s the tool that finally answers all those questions buzzing in your head:
-
How many people visited my site this month? Instead of just guessing, you get a real, hard number.
-
Where did they come from? Did they find you through a Google search in Kelowna, click a link on your Facebook page, or type in your web address directly?
-
What did they do once they got there? You can see which pages are a huge hit with your audience and which ones might need a little love.
-
Are my marketing efforts actually working? This is the big one. Analytics is what connects the dots between your marketing spend and actual, measurable results.
Why It Matters for Your Okanagan Business
Let's be honest—running a small business is a grind. You don't have time or money for tools that are confusing or don't deliver a clear return.
The real magic of Google Analytics is that it replaces guesswork with facts. It empowers you to make smarter decisions about your website and your marketing without needing a degree in data science. It helps you understand what your customers actually want, so you can give them more of it.
By knowing your numbers, you can turn your website from a simple online brochure into your hardest-working employee—one that brings in leads and sales 24/7. Learning the basics of web analytics is a huge step in that direction.
Imagine you're running a small real estate agency in Kelowna, just like some of the partners we work with. You might wonder if it’s worth the effort to set up. Well, consider this: 258,026 companies in Canada are already using it.
That’s because, with Google commanding over 87% of the search engine market share in Canada, nearly all your potential customers are finding businesses like yours through a Google search. Tapping into that data is essential for growth. You can discover more insights about these Canadian web analytics trends.
Your Step-by-Step Setup Guide
Alright, let's get this set up. I promise it’s not as intimidating as it might seem. Think of it like getting the keys to a new shop in Penticton—first, you sign the lease (create the account), then you unlock the front door (set up your property), and finally, you turn on the security cameras (install the tracking code) to see who comes and goes.
This section is all about getting Google Analytics up and running on your website. We’ll be focusing entirely on the current version, GA4. You might still see the old version, Universal Analytics, mentioned in older articles, but it’s now retired. If you're curious about the big shifts, we have a helpful guide explaining what changed when Google Analytics updated to GA4.
First Things First: The Account, Property, and Data Stream
The initial step is straightforward: creating your Google Analytics account. You just need a standard Google account (like your Gmail) to sign in. This account is the main container for everything else.
Next, you'll create a Property. This is simply what Google calls your website or app. If you run a bed and breakfast in Vernon and also have a separate blog about Okanagan travel, you’d have one account holding two distinct properties. It's just a way to keep things organized.
Finally, you’ll set up a Data Stream. This is the specific pipeline that lets data flow from your website into your GA4 property. Setting this up is what generates the unique tracking code you'll need to add to your site.
Don’t get bogged down in the terminology. Account, Property, Stream… it’s just a filing system. The most important part is getting that tracking code onto your website so it can start collecting valuable information for you.
At its core, the entire process is about capturing a visitor's journey and transforming that raw data into a report you can actually use.
The process is pretty simple when you break it down: a person visits your site, Google Analytics tracks what they do, and then it presents that information in easy-to-read reports.
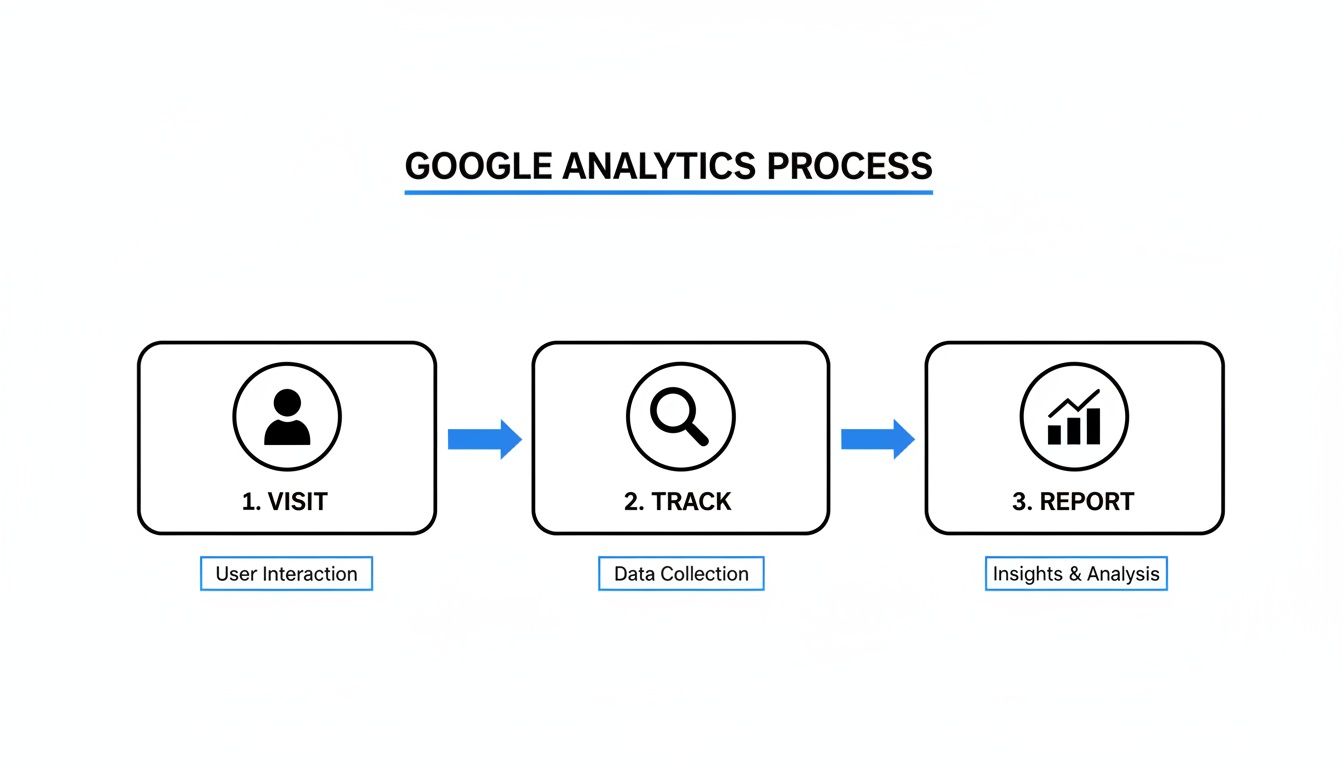
This visual shows how GA4 turns a simple website visit into a powerful insight for your business.
To help you stay on track, I've put together a quick checklist. This breaks down the initial setup into manageable steps so you don't miss anything important.
Your First GA4 Setup Checklist
| Step | What It Means | Quick Tip |
|---|---|---|
| 1. Create a GA Account | This is your master folder. | Use your primary business Google account to keep everything in one place. |
| 2. Create a Property | This represents your website or app. | Name it something clear, like "My Kelowna Bakery Website." |
| 3. Create a Data Stream | This is the data source for your property. | For a website, this will be a "Web" stream. |
| 4. Get Your Measurement ID | This is your unique tracking identifier. | It looks like G-XXXXXXXXXX. Keep this handy! |
| 5. Install the Tracking Code | This connects your site to GA4. | This is the most critical step. Double-check that it's working. |
Following these steps ensures you have a solid foundation. Once the tracking code is live, GA4 will begin collecting data within 24 to 48 hours.
Getting the Tracking Code on Your Website
After you create your Data Stream, Google gives you a tracking code. This little snippet of code needs to be on every single page of your website to work properly.
How you add it depends entirely on your website's platform.
-
For WordPress sites: The easiest way is with a plugin. You can install a GA4-specific plugin, copy and paste your Measurement ID (that G-XXXXXXXXXX code), and you're all set.
-
For Shopify sites: Shopify has a dedicated spot in its settings where you can paste the Google Analytics code snippet directly.
-
For custom-built sites: This is where you might want to tap your web developer on the shoulder. They'll know exactly where to add the code in your site's header files.
Getting this code installed correctly is the most crucial part of the entire setup. If it's missing from some pages, you'll have frustrating gaps in your data—it’s like trying to watch a movie with half the scenes cut out. If you’re not comfortable with this step, it’s a perfect time to ask for a little help to ensure it's done right from the start.
Alright, you've tackled the tricky part. The tracking code is installed on your site, and precious data has started to flow in. Now, when you first log in, you're going to be met with… a lot. Charts, graphs, numbers—it can feel like stepping into an airplane cockpit for the first time.
Don't panic! You don't need to understand what every single button and dial does to get this plane off the ground. We’re going to zero in on the main controls that actually matter to a small business owner. The goal here is to turn that intimidating wall of data into clear, simple insights that help your marketing.
First Glance: The Home Dashboard
The very first screen you'll see in GA4 is your Home dashboard. Think of it as the highlight reel—a quick summary of what’s been happening on your website.
This is your mission control, giving you a quick snapshot of your website's activity.
You'll see little "cards" showing you how many users have visited, where they're coming from, and which of your pages are the most popular. It’s a great way to get a quick pulse check, usually showing data from the last 28 days.
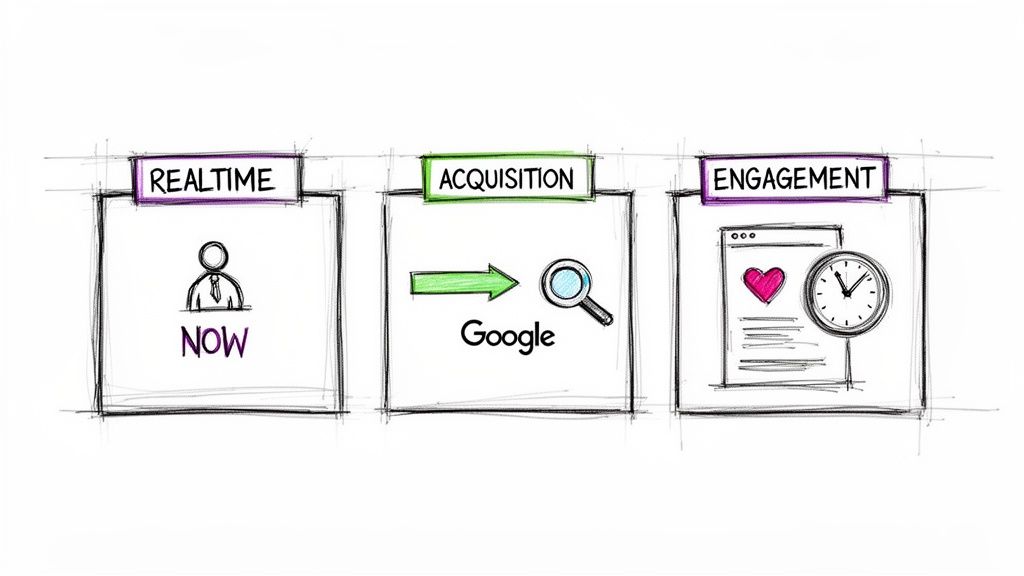
The Realtime Report: See Who's Visiting Right Now
Over on the left-hand menu, you'll spot a section called Reports. Let's start with the first one: Realtime. This report is exactly what it sounds like—it shows you who is on your website at this very moment.
It’s a fantastic way to confirm that your tracking is actually working. Plus, it’s just plain neat to see people interacting with your site live. You can see how many users are active, what pages they’re looking at, and where they are in the world.
The Acquisition Report: How People Are Finding You
Now we're getting to the good stuff. The Traffic Acquisition report (which you'll find under Reports > Acquisition) answers the million-dollar question: How did people find my website?
It neatly breaks down your visitors into a few key categories:
-
Organic Search: This is someone who typed a phrase into Google (like "wineries near Vernon") and clicked on your website from the unpaid search results. This is a massive indicator of how well your SEO is working.
-
Direct: This person typed your website address straight into their browser. They already know you! This is a fantastic sign of strong brand recognition.
-
Referral: A visitor followed a link from another website to get to yours. Maybe a local Okanagan tourism blog gave your business a shout-out.
-
Social: This is all the traffic coming from your social media channels, like Facebook or Instagram.
Understanding where your visitors come from is crucial. It tells you which of your marketing efforts are actually pulling their weight and helps you decide where to focus your time and money.
The Engagement Report: What People Do on Your Site
So, they've arrived at your site. What happens next? The Engagement report shows you exactly that. The real goldmine here is the Pages and screens report.
This report lists your website's pages from most popular to least popular. Seeing your top-performing blog post or your most-viewed service page is incredibly valuable information. It's a direct signal from your audience about what they care about most.
Think about it: if a blog post about "Kelowna's Top 5 Hiking Trails" gets ten times more traffic than any other page, your audience is screaming at you. They're telling you exactly what kind of content they want more of. That’s not just data; that’s your content strategy, handed to you on a silver platter.
It's also worth noting that you're not alone in this. A staggering 71% of small businesses globally use Google Analytics for this very reason. In Canada, where 95.2% of the population is online, understanding this digital body language is a top priority. You're joining a huge community of business owners turning data into better customer experiences.
Finally, let's quickly clear up a few common terms you'll bump into:
-
Users: The number of unique individuals who visited your site.
-
Sessions: A group of interactions one user takes within a certain time. If one person visits your site in the morning and again in the evening, that’s one user and two sessions.
-
Event count: GA4 is "event-based," which just means it tracks actions. An "event" could be a page view, a scroll down the page, or a click on a button.
Don't get too bogged down in the jargon at first. Just focus on these three core reports—Acquisition, Engagement, and Realtime. They’ll give you a solid foundation and more than enough insight to start making smarter decisions for your business. If you're feeling a bit overwhelmed, that's completely normal. Working with a partner to translate this data into a clear plan is often the best next step.
Tracking What Truly Matters to Your Business
All this data is great, but let's be honest—what really moves the needle for your business is seeing actual results. This is where we connect the dots between all those numbers in Google Analytics and your real-world business goals. It all starts with one simple question: what do you want people to do on your website?
Think about it for a moment. If you run an e-commerce shop, you want a sale. Plain and simple. If you're a real estate agent in West Kelowna, your goal is getting someone to fill out your contact form. And if you operate a tourism business in the Okanagan, you're hoping people will smash that "Book Now" button.
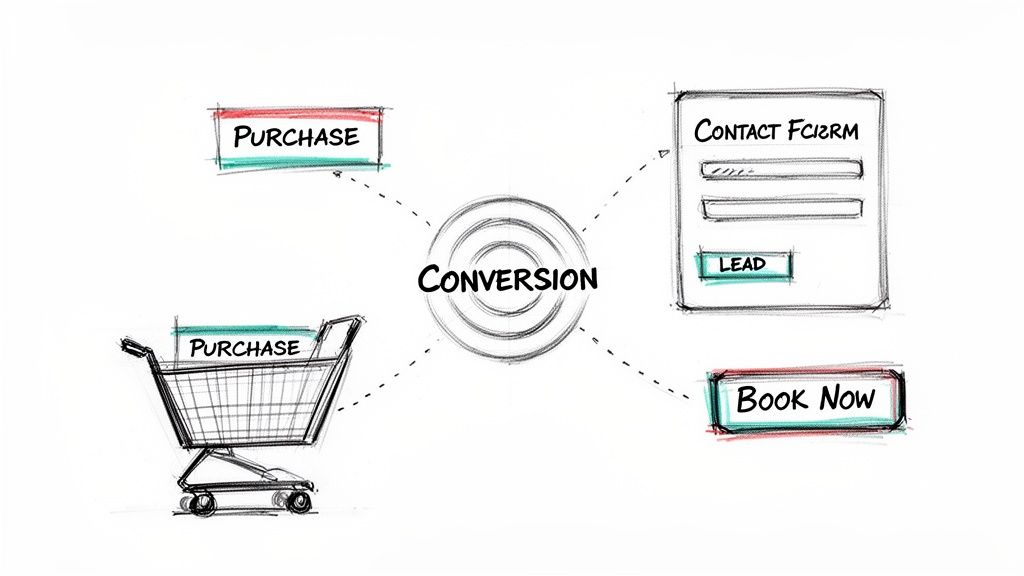
These crucial actions—the ones that directly impact your bottom line—have a special name in Google Analytics: conversions.
Why Conversions Are Everything
Setting up conversion tracking is like telling your sharpest employee, "Hey, can you let me know every single time someone asks for a price list or books a meeting?" It immediately shifts your focus from vanity metrics (like how many people visited a page) to action metrics that matter (like leads and sales).
This is how you start measuring your website's true performance. All of a sudden, you can see exactly which marketing campaigns are making you money and which ones are just making noise. It's that "aha!" moment when the data stops being a bunch of abstract numbers and starts driving your business decisions.
Marking Key Events as Conversions
Remember how we mentioned GA4 is "event-based"? This is where that concept really starts to click. An "event" is basically any action a user takes, whether it's viewing a page (page_view) or scrolling down (scroll). The genius of GA4 is that you can point to any one of these events and tell Google, "This one is important. This is a conversion."
A conversion isn't some mystical, overly complex metric. It's just a regular event that you've flagged as being valuable to your business. That's it.
Let's say you have a "Thank You" page that visitors only see after they successfully fill out your contact form. The event of someone viewing that specific page (a page_view where the page location is /thank-you) is the perfect candidate to mark as a conversion. From then on, every time that event fires, GA4 will chalk it up as a new lead.
How to Set Up Your First Conversion
Let’s walk through it together. We'll set up a conversion for a contact form submission—a vital goal for nearly any service-based business.
-
Identify Your "Thank You" Page: First thing's first, you need a unique page that users only land on after completing the desired action. For a contact form, this is usually a dedicated page with a URL like
yourwebsite.ca/thank-you. -
Go to Your Events Report: In your GA4 account, navigate to the Admin section (the little gear icon in the bottom-left corner). Find the Property column and click on Events.
-
Create a New Event: Click the blue Create event button. This is where you'll tell Google the specific rules for your valuable new event. You'll set up a condition that says when the
event_nameispage_viewAND thepage_locationcontains/thank-you, you want to create a new event calledgenerate_lead. -
Mark it as a Conversion: Now, head over to the Conversions tab (it’s right under Events in that same Admin section). Click New conversion event, and simply type in the name of the custom event you just created:
generate_lead.
And you're done! From this point on, every time someone lands on your "Thank You" page, Google Analytics will record a conversion. You're no longer just tracking website visitors; you're tracking potential customers. We explore this topic more in our guide on how to track website visitors effectively.
This is the foundational step that turns Google Analytics from an interesting dashboard into an indispensable part of your marketing strategy. It’s how you finally connect all those clicks and visits to real, tangible business growth.
Common Mistakes Beginners Make
When you're just getting started with something new, a few missteps are part of the learning process. That’s completely normal. We've been helping Okanagan businesses get a handle on their marketing since 1993, so believe me when I say we've seen just about every mistake in the book! This section is our way of giving you a friendly heads-up on what to watch out for.
Think of this as a cheat sheet to get cleaner, more reliable data right from the start. Dodging these common pitfalls will save you a lot of frustration later and ensure you can actually trust the insights GA4 is giving you.
Not Filtering Your Own Visits
This is the number one slip-up we see, and it's a big one. While you're busy building or updating your website, you and your team are probably visiting it dozens of times a day. Every one of those clicks, scrolls, and page loads gets counted by Google Analytics, which can seriously throw off your numbers.
It inflates your traffic, making it look like you have more visitors than you actually do, and it can tank important metrics like your engagement rate. We once helped a Kelowna partner whose traffic numbers were slashed in half after we filtered out their team’s activity—but suddenly, their data became 100% more accurate and genuinely useful.
Thankfully, there’s a simple fix. You can create a filter in GA4 to exclude all traffic coming from your office's IP address. It’s a five-minute job that ensures the data you’re analysing reflects real customers, not just your own team admiring your handiwork.
Only Looking at Surface-Level Numbers
It’s always a thrill to see your total user count climb, but that number by itself doesn't give you the full picture. It's like judging a restaurant's success by how many people walk in the door, without knowing if they sat down for a three-course meal or just glanced at the menu and walked out.
The real insights come when you dig just one layer deeper.
The most powerful insights are rarely on the main dashboard. They’re found when you start asking "Why?" Why is this page so much more popular than that one? Why are visitors from Instagram leaving almost immediately?
Real business growth comes from understanding the behaviour behind the numbers. Instead of just celebrating a spike in traffic, look at which sources are bringing in visitors who actually become leads or make a purchase. That's the kind of information that helps you make truly smart marketing decisions.
Setting Up Tracking Incorrectly
This one can be a silent killer for your data. If your tracking code isn't installed properly on every single page of your site, you’ll have huge blind spots. It's like trying to monitor your shop with security cameras that only cover half the rooms.
We've seen it happen time and again: a business launches a beautiful new website redesign, but the developer forgets to add the tracking code to the new blog section or the all-important contact page. Just like that, valuable data from those key areas vanishes into thin air.
Here are a few common tracking setup errors to watch for:
-
Missing Code on New Pages: Whenever you add a new page or section to your site, make it a habit to double-check that the GA4 code is present.
-
Duplicate Tracking Codes: Accidentally installing the code twice on the same page can cause all sorts of reporting chaos, like artificially low bounce rates and double-counted pageviews.
-
Wrong Measurement ID: It's a simple copy-paste error, but using the wrong G-XXXXXXXXXX ID from another GA4 property will send all your valuable data to the wrong place.
Getting the setup right from day one is absolutely crucial. If you're ever in doubt, having a second pair of expert eyes review it can give you the peace of mind that you’re building your strategy on solid ground. And if you’re feeling a bit lost, our team is always here to help.
Alright, you’ve done the hard part. The tracking code is installed, the reports are populating, and you’re starting to see some real data flow in. High five! You're officially past the most intimidating stage.
But now you’re looking at a screen full of charts and numbers, probably thinking, "Okay… so what?" This is where the magic happens. It's time to turn that raw data into actual improvements for your business. We're not talking about needing a degree in data science, either. It’s about making a few smart observations that can have a huge impact on your marketing and your customers' experience.
Your Simple Starter Checklist
To get the ball rolling, here are three practical things you can do right now with the data you have. Think of it as your first, no-fuss action plan.
-
Find Your Most Popular Content (and Make More of It)
Pop over to the Engagement > Pages and screens report. Sort the list by "Views" and see what rises to the top. Is there a page or blog post that’s getting way more traffic than everything else? Maybe an article like "Top Patios in Kelowna" is a runaway hit.That’s a direct message from your audience about what they find valuable. The action step here is straightforward: give them more of what they love. Brainstorm related topics. Could you write about "The Best Family-Friendly Patios" or create a guide to "Patios with the Best Happy Hour"? You're simply following the breadcrumbs your visitors are leaving for you.
-
Check How People See Your Site (and Optimize for It)
From the main menu, head to User > Tech > Tech details. This report shows a breakdown of the devices people use to visit your site: Desktop, Mobile, and Tablet. Don't be shocked if you see that 70-80% of your traffic is coming from smartphones. We see this constantly with our partners.The takeaway? Your website absolutely has to be fantastic on a small screen. Seriously, grab your phone right now and pull up your site. Is the text readable without pinching and zooming? Are the buttons big enough to tap easily? If the experience is clunky, you’ve just found your number one priority.
-
Discover Your Best Traffic Source (and Double Down)
Now, go to the Acquisition > Traffic acquisition report. This is where you see how people are finding you. Is "Organic Search" bringing in the most visitors? Or is that Facebook page you've been posting on sending a surprising amount of traffic your way?Once you know which channel is your strongest performer, you know where to focus your marketing energy. If Google Search is your MVP, that’s a clear signal that putting more effort into your SEO will pay off.
This is what a data-informed strategy looks like in its simplest form. You find what's working, and you do more of it. It’s all about making small, intentional tweaks based on what real people are actually doing on your site.
And hey, if you're looking at these reports and still feel a little overwhelmed trying to figure out the next best move, that's perfectly normal. Turning this data into a clear, winning strategy is what our team at Navigator does all day, every day. If you’re ready to turn insights into real results, let's chat about a plan for your business.
Frequently Asked Questions
We talk to business owners all the time who are just starting to figure out their website analytics. It's a new world for a lot of people, so it's completely normal to have questions. We've put together some of the most common ones we hear to help you get started.
What's the Difference Between GA4 and Universal Analytics?
You've probably come across tutorials or blog posts that mention "Universal Analytics" or "UA." That was the old-school version of Google Analytics, and while it was great for its time, it's now been fully replaced. Google Analytics 4 (GA4) is the only version that matters now.
Here’s a simple way to think about it: Universal Analytics was like a turnstile at a stadium, counting how many people came in (sessions). GA4 is more like having a camera on every seat, tracking individual actions (events). It sees not just who came in, but what they did—did they buy a hot dog, find their seat, or join in the wave? This event-based model is built for the modern internet, where customers interact with you across both your website and your app.
Can I Use Google Analytics on Any Website?
Absolutely. It doesn't matter if your site is on WordPress, Shopify, Squarespace, or is a completely custom-coded project. Google Analytics can be installed on virtually any platform.
The setup process just varies a bit. On platforms like WordPress, you can often use a simple plugin where you just copy and paste your Measurement ID. On others, you might need to add a small snippet of code directly into your site’s header. Either way, it’s a standard part of getting any website ready for business.
How Long Does It Take to See Useful Data?
Once you have the tracking code installed correctly, you'll start seeing data pop into your reports within 24 to 48 hours. If you're eager to see if it's working, the "Realtime" report will show you activity almost instantly.
But here’s the key: seeing useful data takes a little patience. You need more than just a day's worth of numbers. Let it run for at least a week, or even better, a full month. This gives you enough information to spot real trends and patterns, moving past the daily noise to see the bigger story of how people are actually using your site.
Feeling like you've got the basics down but aren't quite sure how to turn all this data into a smarter marketing plan? At Navigator Multimedia, we specialize in helping Okanagan business owners translate these numbers into real-world results. If you're ready to make your website an even stronger asset for your business, we're here to help.