How to Track Website Visitors and Grow Your Business
If you want to know what's happening on your website, you'll need a web analytics tool like Google Analytics. The setup is pretty simple: you create an account, which gives you a unique bit of tracking code. Then, you or your web developer will pop that code snippet into your website.
Once it's in place, the tool starts collecting anonymous data about how people use your site, like which pages they visit and how they got there in the first place.
Why Tracking Your Website Visitors Is Worth It
Ever feel like your website is just a billboard on a deserted highway? You've invested time and money to make it look great, but you have no real clue who's visiting, what they're doing, or if any of it is actually working. It’s a common frustration, especially for small business owners right here in the Okanagan.
Let's break down why tracking your visitors is one of the smartest things you can do for your business. Think of it like flipping the lights on in a dark warehouse… suddenly, you can see everything.
Get to Know Your Audience
Tracking helps you collect clues to understand who is genuinely interested in what you offer. You can finally see which pages people actually care about and where they're coming from. Is it someone just down the road in Kelowna, or a potential client checking you out from Pentton? It's a whole lot better than just taking a wild guess.
It’s like getting to know your customers before they even walk through the door. Once you have a clearer picture of who you're talking to, you can fine-tune everything—from the language on your homepage to the images you use—to connect with them on a deeper level.
Tracking data tells the story of what your potential customers need. It’s the first real step to making your website work smarter for you.
This insight helps turn your website from a passive brochure into an active member of your sales team, guiding those anonymous clicks toward becoming actual customers. Plus, knowing where your visitors are based is a huge advantage for focusing your local marketing budget where it counts.
See What’s Actually Working
Without data, you’re just throwing spaghetti at the wall and hoping something sticks. With website tracking, you get clear proof of what's working and what's not. For example, did that Facebook ad campaign you ran last month actually send quality traffic to your site? Are your blog posts bringing in new visitors from Google?
This is all about making decisions based on evidence, not just a gut feeling. You’ll be able to answer critical questions like:
-
Top Pages: What content on your site is the most popular? This is what people care about most.
-
Traffic Sources: How did people find you? Was it Google, a social media link, or did they type your URL directly?
-
Device Usage: Are most of your visitors browsing on their phones while on the go, or are they sitting at a desktop computer?
For years now, we've seen a massive shift toward mobile. Big brands have poured resources into making their sites mobile-friendly, and for good reason. You can read up on recent website statistics to see the bigger picture, but understanding your own audience’s device habits is a key piece of the puzzle you can solve with the right web analytics setup.
Your First Steps with Google Analytics 4
Alright, let's get our hands dirty and start tracking who's visiting your website. The main tool for this job, and the industry standard, is Google Analytics 4, or GA4 as you'll hear it called. It might sound a bit intimidating, but I promise we’ll break it down into simple, manageable pieces.
Right now, the goal is just to get the data flowing. You don't need to be a data wizard overnight. We're simply turning on the tap to start collecting those valuable insights about what's actually happening on your digital storefront.
Setting Up Your GA4 Account
First things first, you'll need a Google account. If you’re already using Gmail or Google Ads for your business, you're good to go. Head over to the Google Analytics website to kick things off.
You'll be prompted to create a new "Account." Just use your business name here. Think of this as the main filing cabinet where all your website data will live. It’s a simple way to keep everything organized, and you'll appreciate that down the road.
Next up, you'll create a "Property," which is just Google's term for your website. If your business is "Kelowna Window Cleaning," you can name the property the same. Google will ask for a few basic details like your industry and time zone. Easy peasy.
Finding and Installing Your Tracking Code
With your property set up, Google generates a unique tracking code. This little snippet of code is the secret sauce—it’s what connects your website to GA4 and lets it start gathering that anonymous visitor data.
What you're looking for is your Measurement ID. It’ll look something like G-XXXXXXXXXX. This is your website's unique identifier.
Now comes the part where you add this code to your site. For most local businesses in Vernon running on WordPress, this is surprisingly straightforward. You can usually use a simple plugin that gives you a dedicated field to just paste your Measurement ID into. No coding required.
If you’re not on WordPress or feel a bit out of your depth, that's completely fine. This is a five-minute job for a web developer, and getting it right is crucial. Sometimes, it’s just better to let an expert handle it to ensure you’re tracking accurately from day one.
The most important part is just getting it done. Don't let the technical side become a roadblock. Installing this code is the single most important step toward truly understanding how your website is performing.
This simple flow chart really breaks down why this is so valuable. It shows how you turn those anonymous website clicks into real, actionable insights that help you find your next customer.
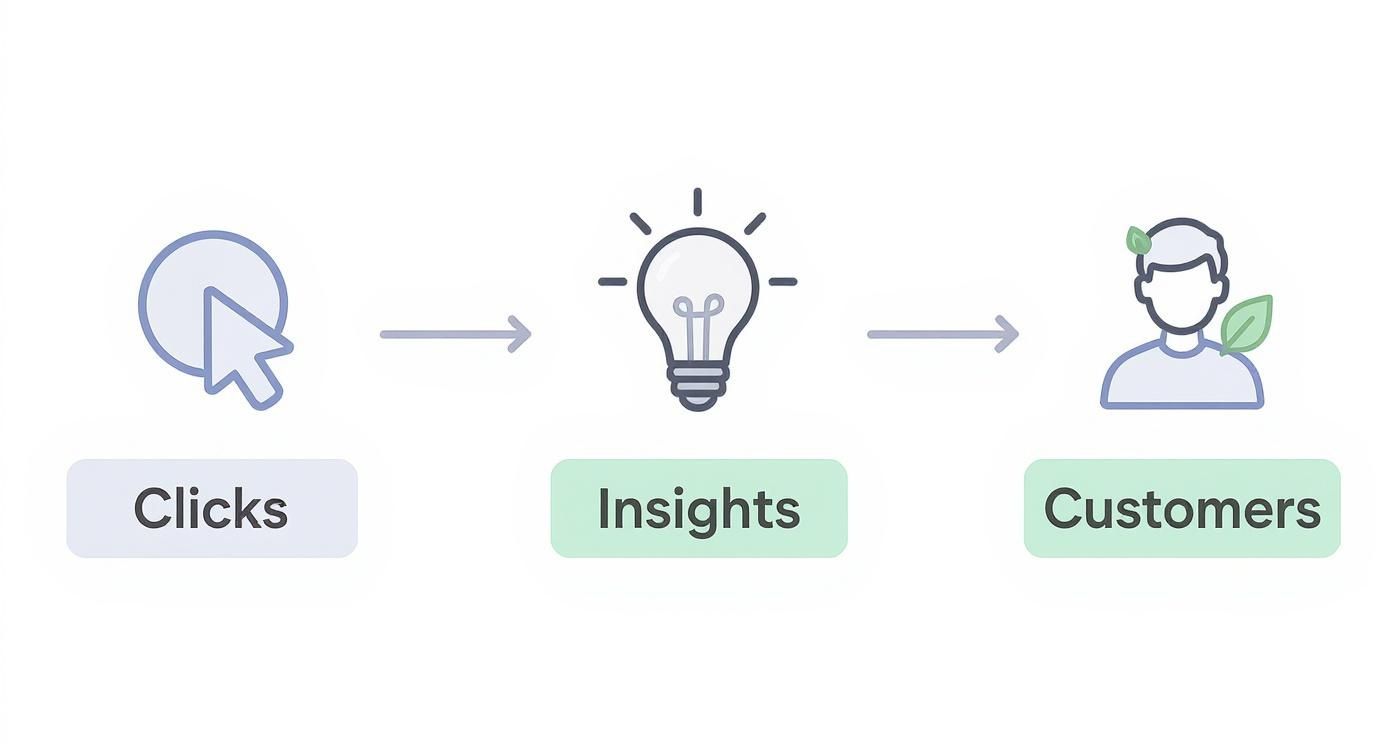
As you can see, there's a clear path from tracking clicks to gaining customer insights, which is the foundation of making smarter business decisions online.
Once that code is live on your site, that’s it! Your GA4 account will begin pulling in data. It can take 24-48 hours for the first numbers to show up in your reports, so don't panic if you don't see anything right away. Go grab a coffee—you've just taken a massive step forward.
Decoding Your Audience and Their Journey
Okay, the data is finally trickling in. You’ve got Google Analytics 4 up and running, but now what? Staring at all those charts and numbers can feel like trying to read a foreign language at first.
This is where the real work begins—and it's actually pretty interesting. It’s time to piece together the story of who your website visitors are and what they're up to. We'll walk through a few key reports in GA4 that act like a digital trail, showing you exactly who's stopping by and what they do once they arrive.
Who Are Your Visitors?
First things first, let's get a handle on who's actually on your site. The Demographics reports in GA4 give you a fantastic high-level overview. You can quickly see details like the general age range of your audience and, more importantly for a local business, where they're located.
Are most of your visitors coming from right here in Kelowna? Or are you suddenly getting a surprising amount of attention from folks in Vernon or Penticton? This simple insight is incredibly powerful—it can help you decide exactly where to focus your marketing budget and confirms if your message is landing with the right local crowd.
How Did They Find You?
Next up is one of the most critical questions you can ask: how did people find your website in the first place? For this, we'll peek at the Acquisition reports. Think of this report as a roadmap showing all the different paths people took to get to your digital doorstep.
Did they find you through:
-
Organic Search: Someone typed a phrase like "landscapers in West Kelowna" into Google and clicked on your site.
-
Direct Traffic: They already knew your business and typed your website address straight into their browser.
-
Referral: They clicked a link from another website that mentioned you—maybe a local business directory or a blog.
-
Social: They came from a post you shared on Facebook or Instagram.
Knowing this tells you what's actually working. If you see a ton of traffic from organic search, your SEO efforts are paying off! If a specific social media campaign sent a flood of new visitors, you know it was a hit.
Understanding how people find you is half the battle. It shows you which marketing channels are your heavy hitters, so you can double down on what’s bringing in potential customers.
The web has also seen a massive shift in how people browse. As of late 2025, a whopping 64.35% of global web traffic comes from mobile devices—a huge jump from just 0.72% back in 2009. It's crucial to check your own reports to see what devices your specific audience uses, as it might be different.
What Do They Do on Your Site?
Once visitors land on your site, what happens next? The Engagement reports show you which pages are really holding their attention. You can see your most popular pages, how long people are sticking around, and which pages they tend to visit next.
If you offer multiple services or products, this is gold. You might discover that a specific blog post or service page gets way more eyeballs than you ever expected. For those running more complex sites with different domains—like a main site and a separate booking portal—we've got a helpful guide on configuring cross-domain tracking to keep your data connected and accurate.
By looking at these three areas—Demographics, Acquisition, and Engagement—you start building a clear, actionable picture. You’re no longer guessing; you’re seeing the real story of your visitors, one click at a time.
Going Beyond Numbers with Visual Analytics
Data from Google Analytics is fantastic, but let's be honest—staring at charts and spreadsheets can feel a bit dry after a while. The numbers tell you what is happening on your site, but they rarely explain the why behind it.
This is where visual analytics comes into play, and frankly, it's my favourite part of the process. You get to actually see what people are doing.

It’s all about adding a human element to the raw data. Instead of just knowing a page has a high bounce rate, you can start to piece together the frustration that’s causing people to leave.
Seeing Your Website Through Your Visitors’ Eyes
The two main tools I rely on for this are heatmaps and session recordings. They might sound technical, but the concepts are incredibly simple and powerful.
-
Heatmaps create a visual overlay on your webpages. They show you exactly where people click, where they move their mouse, and—crucially—how far down the page they scroll. Think of it like a weather map: hot spots (red and yellow) show where all the action is, while cool spots (blue and green) highlight the areas getting ignored.
-
Session Recordings are even more direct. These are literal video replays of a visitor's journey through your site. You can watch as they move their cursor around, click on links, fill out (or abandon) forms, and navigate from one page to the next.
These tools are all about building genuine empathy for your users. You get a front-row seat to the exact moments they get confused, what immediately catches their eye, and what they completely miss.
Uncovering Game-Changing Insights
Imagine watching a session recording and seeing a potential customer try to click on a high-quality product image five times, thinking it’s a link to learn more. That's a missed opportunity.
Or what if a heatmap of your homepage reveals that everyone is clicking a photo of your team, but it doesn't lead anywhere? That’s an easy-to-fix issue you'd never spot in a standard analytics report.
I remember working with a client in Kelowna whose contact page just wasn't generating form fills. The numbers looked low, but we didn't know why. By setting up a scroll map (a type of heatmap), we discovered that 90% of visitors never even scrolled down far enough to see the contact form! A simple redesign that moved the form up solved the problem instantly.
Visual analytics tools expose the hidden friction on your website. They show you exactly where a simple design tweak can make a massive difference in how people experience your brand online.
These aren't just cool gadgets; they're powerful diagnostic tools. They help you spot confusing design elements, unclear content, or broken links that are frustrating your visitors and costing you business. You can make smarter improvements based on real human behaviour, not just spreadsheet guesswork.
Getting this kind of clarity can be tricky on your own, but working with someone who can interpret these visuals makes all the difference. If you're ready to see what your visitors are really doing, we can help you set this up and find those insights.
Turning Your Visitor Data into Smart Decisions
Collecting data is one thing; using it to actually grow your business is where the magic really happens. Let's connect the dots and talk about turning all those numbers and charts into practical, money-making actions.
Think of this process as making your website an active, contributing member of your sales team. It’s all about listening to what the data is telling you and then acting on it with confidence.
From Insights to Actionable Steps
So, how does this look in the real world?
Let’s say your Google Analytics report shows a blog post you wrote last year about a niche service is still bringing in a steady stream of organic traffic. That’s a massive clue! It’s telling you that people are actively searching for that topic, and you should absolutely double down and create more content just like it.
Here’s another example from our own experience. We were working with an Okanagan-based client who couldn't figure out why their contact form wasn't getting many submissions. A quick look at a heatmap showed us that almost nobody was scrolling far enough down the page to even see the form. It was basically invisible.
The fix was simple: we moved the form right to the top of the page. The result? Form submissions nearly doubled in the first month.
Your data is a roadmap to better results. Every chart, every heatmap, and every report is pointing you toward an opportunity to improve your website's performance and get more leads.
This process of finding and fixing these small but mighty issues is a key part of what’s known as conversion rate optimization. It’s about making smart, data-backed tweaks that lead to big wins over time.
Small Changes Lead to Big Results
The goal is to spot patterns and make informed decisions. This creates a continuous loop: you observe your audience's behaviour, you make their experience better, and you measure the results.
Here are a few common scenarios and the smart decisions they often lead to:
-
You notice high mobile traffic: If you see that most of your visitors are on their phones, your website must be fast and easy to use on a small screen. No excuses.
-
You identify your most popular pages: Your top five most-visited pages tell you exactly what your audience cares about most. Make sure those pages have crystal-clear calls-to-action, like a prominent "Request a Quote" button or a click-to-call phone number.
-
You find pages with high exit rates: If tons of people are leaving from a specific service page, it might be confusing or missing key information. Maybe it's time to rewrite the content, add a video explainer, or include some customer testimonials.
It can feel a little overwhelming to sort through all this on your own. Sometimes, just having a partner to help you interpret the data and prioritize what to tackle first can make all the difference.
Your Website Tracking Questions, Answered
Getting started with website tracking always stirs up a few questions. That's totally normal. Let's tackle some of the most common ones we hear from local business owners who are new to this.
Is It Legal to Track Website Visitors?
Yes, it absolutely is. Using standard tools like Google Analytics to track website visitors is a completely normal and legal business practice. The most important thing is simply being transparent about it.
You just need a clear privacy policy on your website that lets people know you're collecting anonymous data to improve their experience. Regulations in Canada, like PIPEDA, set the guidelines, and a well-written policy ensures you're on the right side of them. It's all about being respectful while gathering the insights you need to better serve your customers.
How Soon Will I See Useful Data?
You'll see numbers pop up in your analytics account almost immediately after the tracking code is live. But the key word here is useful data, and that takes a little bit of time to build up.
To spot real trends and avoid making decisions based on one unusually slow Tuesday, you'll want to let the data collect for at least a few weeks. Ideally, give it a full month. This gives you a big enough sample size to see genuine patterns in your traffic and identify which pages are truly resonating with your audience.
Patience is key. Let a month's worth of data roll in before you start making any big changes. Good decisions are based on trends, not single-day spikes or dips.
Can I See Exactly Who Is on My Website?
Nope, and honestly, that’s a good thing for everyone's privacy. Analytics tools are specifically designed to show you anonymous, grouped data.
You can see valuable information like the city a visitor is from (like Kelowna or Vernon), what kind of device they're using, and which pages they looked at. But you absolutely cannot see personal details like their name, email address, or phone number. The whole point is to understand general user behaviour, not to monitor specific individuals.
What Is the Biggest Mistake Businesses Make?
The single biggest mistake we see is the classic "set it and forget it" approach. Many businesses go through the effort of installing an analytics tool but then never actually log in to look at the data. That information is only valuable if you check in regularly and use it to make smarter decisions.
The second biggest mistake? Getting overwhelmed by all the charts. Don't try to boil the ocean. Start small. Pick just one or two simple metrics to watch—like "Users" and "Top Pages"—and get comfortable with what those numbers are telling you before you try to dive any deeper.
Understanding your website data is the first step to turning your site into your best salesperson. If you’re ready to stop guessing and start growing, the team at Navigator Multimedia can help you make sense of the numbers and turn them into real results. Let’s have a chat about it.